Move Away From Static Business Reporting With Interactive Dashboard For KPI Reporting
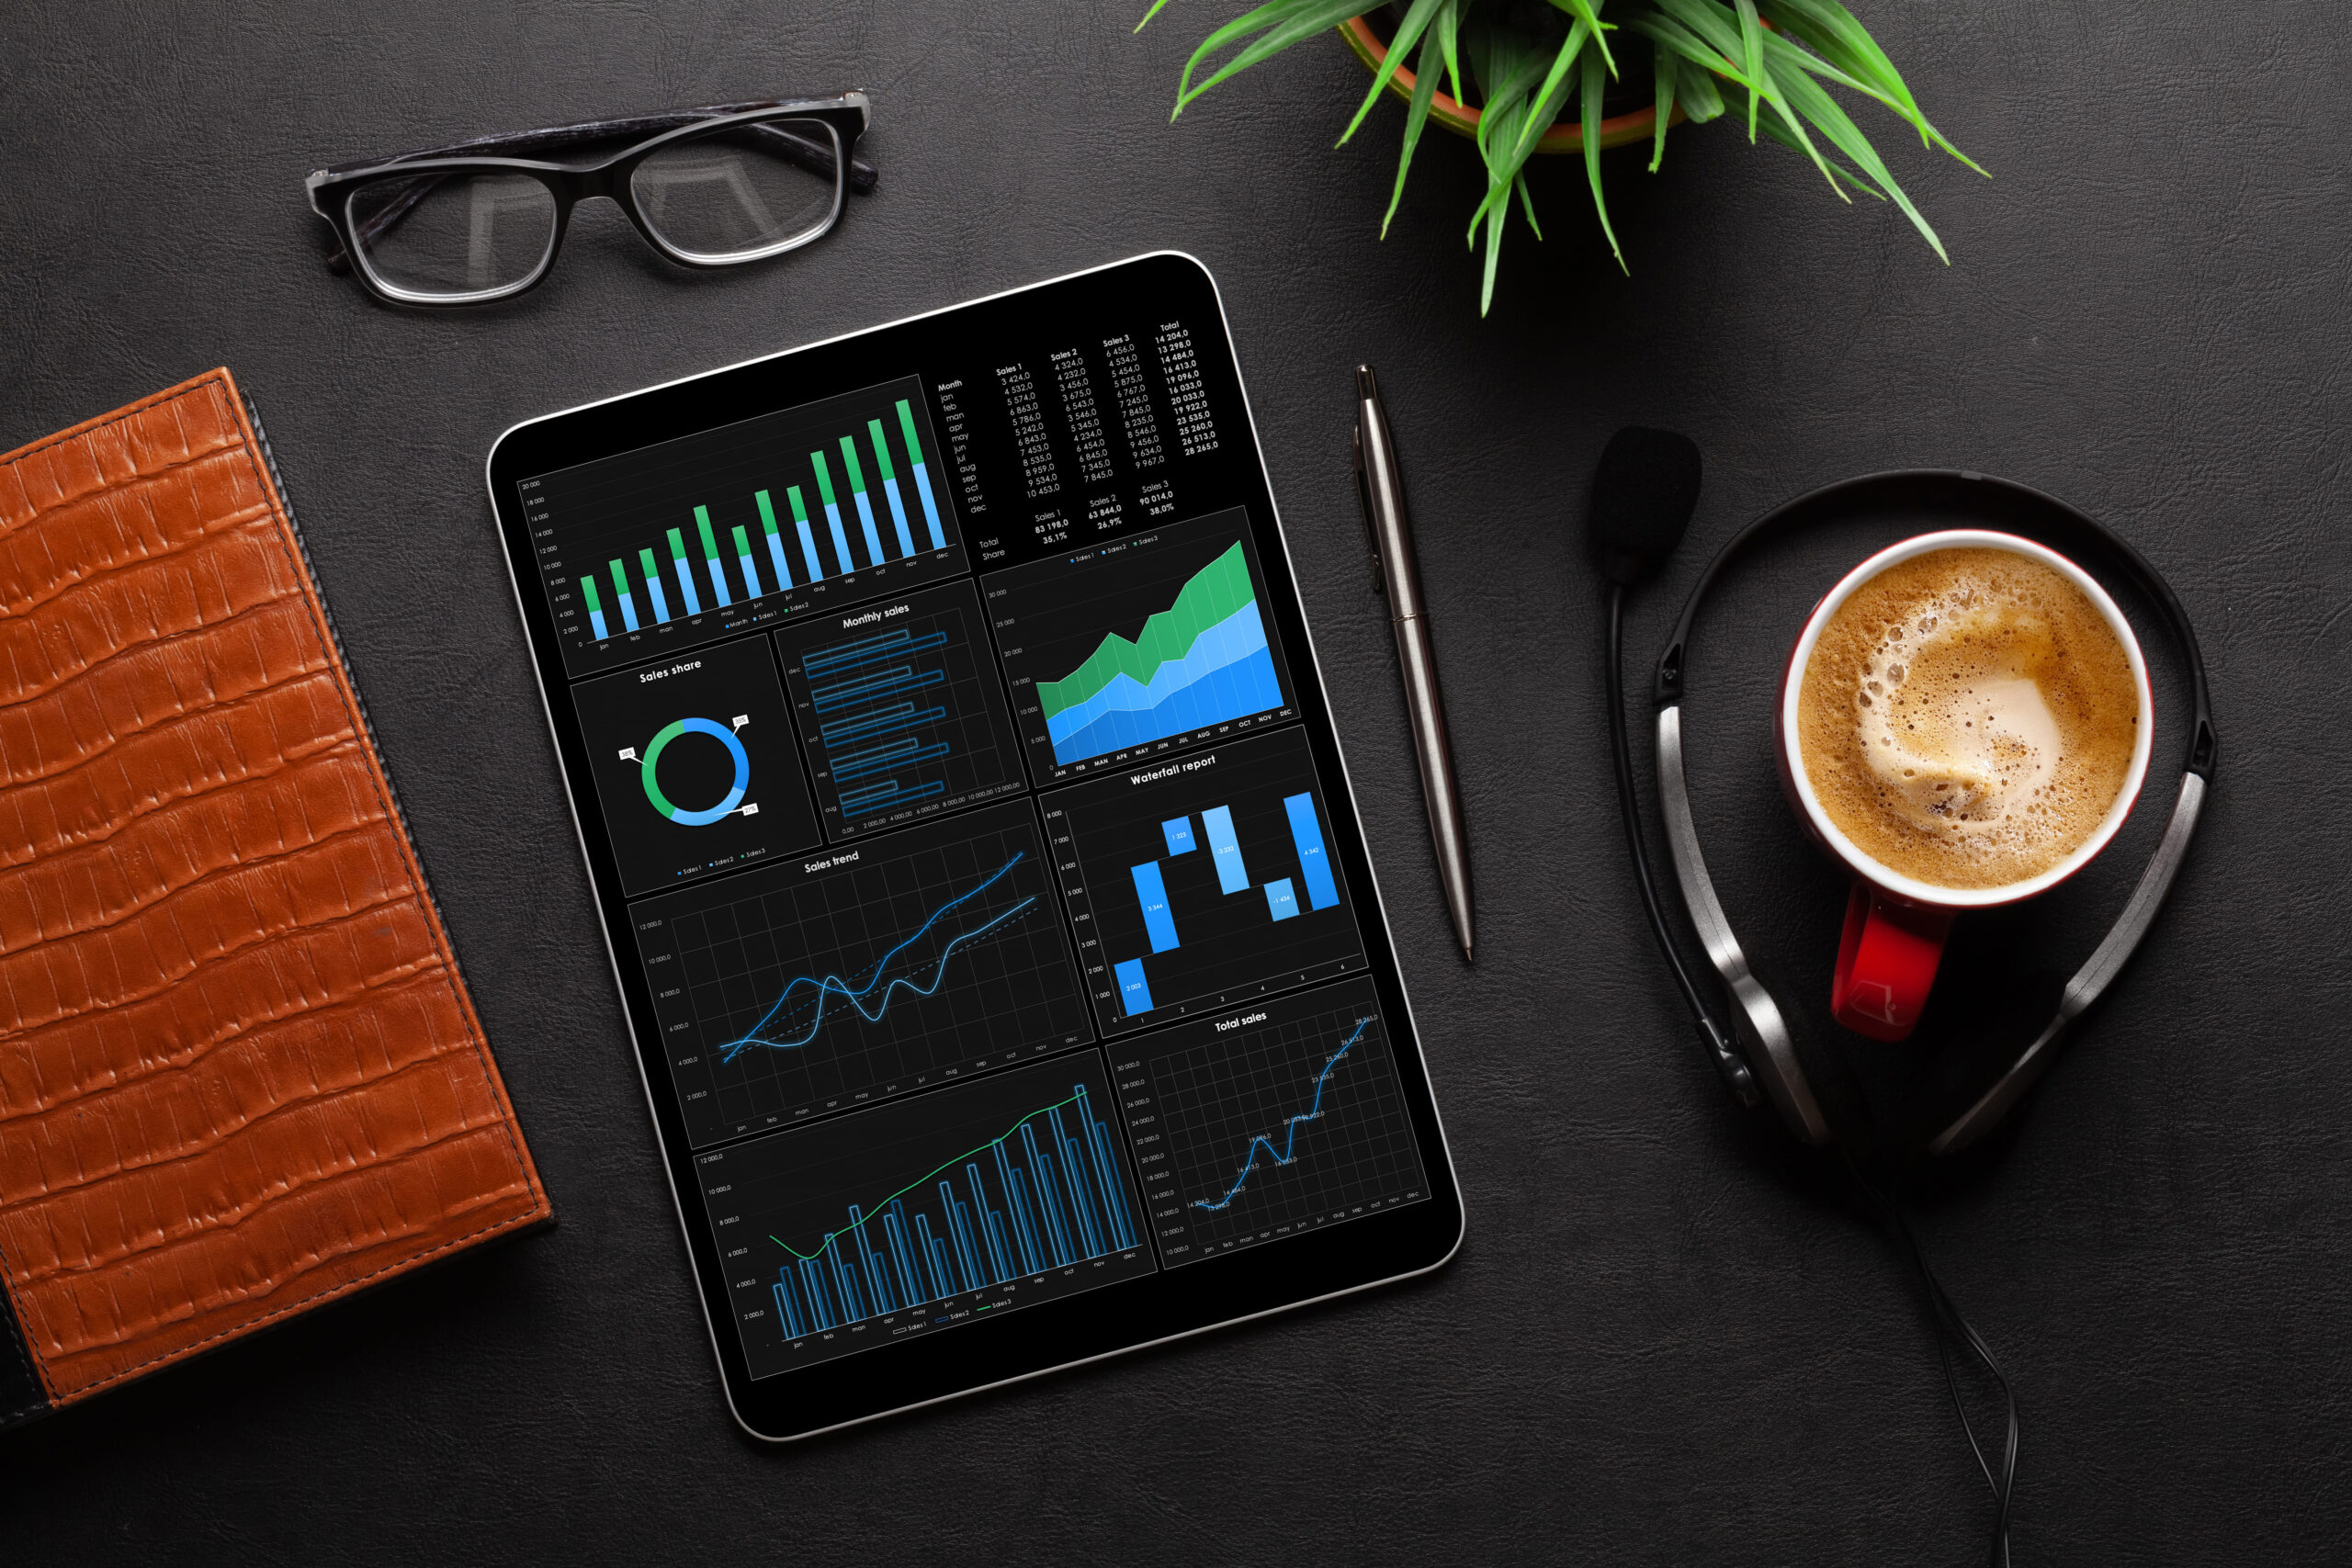
Today’s data-rich business environment supports so much information that a dashboard software for KPI reporting has become a valuable resource. Having an interactive single screen to visualize data and insights has become a business necessity.
Businesses must understand their audience, collate relevant business information, analyse it and leverage on the insights to make strategic decisions. This is how tracking KPI and making sure information is presented in useful format comes in. Thus, having a KPI reporting tool is essential to help streamline the process and the data presented.
KPI is a management tool to measure, organise and analyse key business performance indicators helping organisations understand current business standing, identify strengths, weaknesses and trends to help strategise to reach business goals. Modern KPI reporting is presented using interactive dashboard, a visual report presentation that provides information on data associated with each performance indicator.
A dashboard’s main purpose is to simplify the presentation and analysis of data from massive information collected on a daily basis. An interactive dashboard is a data management tool that tracks, analyse, monitor and visually present key metrics while providing the user interactive data. This gives them opportunity to drill down on each metric for better understanding of root cause, enabling them to make well-informed, data-driven business decision.
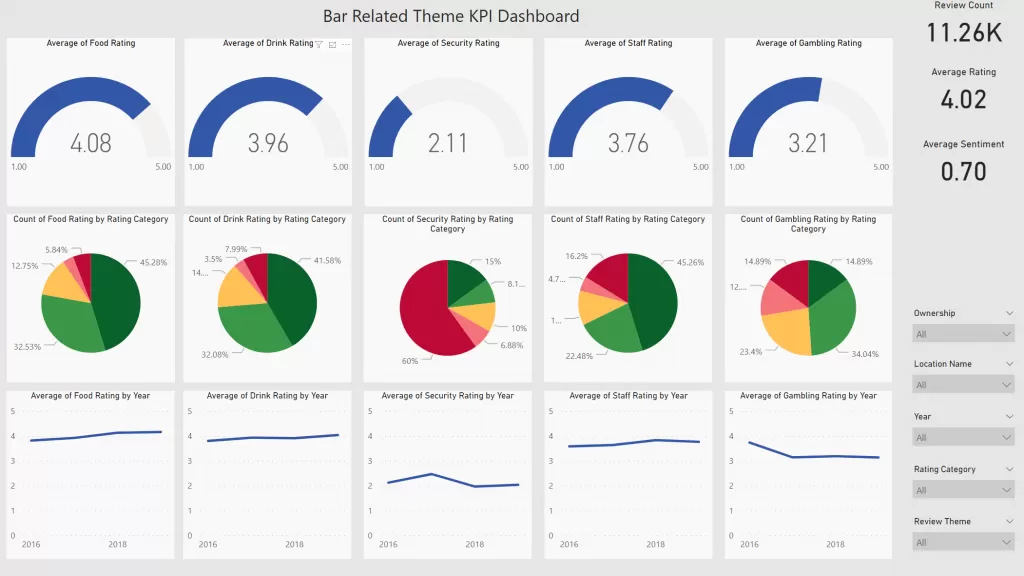
With the ability to provide different perspective and view points in just a few clicks provide users interactive analytic powers necessary for critical business decisions. Get detailed information, zoom in and out and add as much parameters to provide you with necessary information. With up-to-date and real-time data, executives are on top of the business situation all the time to make critical decisions.
Get in touch with AI Consulting Group via email, on the phone, or in person.
Send us an email with the details of your enquiry including any attachments and we’ll contact you within 24 hours.

Call us if you have an immediate requirement and you’d like to chat to someone about your project needs or strategy.

We would be delighted to meet for a coffee, beer or a meal and discuss your requirements with you and your team.